

Crypto Casino Market Report September 2026: Deposits, Whales and Reserves Tracked Onchain
This report tracks $48.8 billion in onchain deposit volume across 41 crypto casinos, 16 cryptocurrencies and 10 blockchain networks over the trailing 12 months. It is the most detailed set of crypto gambling statistics available from any public source. The data comes from Tanzanite.xyz, an analytics platform that monitors verifiable blockchain transactions flowing into known casino wallet clusters.

Every Tanzanite figure in this report can be checked onchain. In September, the 41 tracked operators took $4.97 billion across 7.46 million deposits, 15% more money on 3% fewer transactions. Stake alone held a 45.5% market share.
The 41 operators tracked here include the largest centralized crypto casinos by deposit volume, such as Stake, Roobet, Duel, Rainbet, BC Game, Gamdom and Shuffle, alongside smaller ones. They do not represent the entire crypto gambling market. Fiat-first online casinos that also accept crypto are excluded, as are other crypto-native casinos outside Tanzanite’s coverage.
Third party estimates of the total crypto casino market range from $250 million to $81.4 billion, because sources measure different things, from gross gaming revenue to B2B software spend, and some publish no method at all. We reference those estimates for context throughout the report, labeled with their source and what each one actually measures. Our own analysis is built entirely on the Tanzanite dataset.
The sections below cover operator rankings and month on month movers, average deposit sizes and how deposit value is distributed, how few wallets actually drive the market, which currencies and blockchains players use, what casinos hold in their hot wallets, and the regulatory shifts reshaping the market. One finding frames the rest of the page: just 4,440 wallets, 0.34% of the 1.32 million that deposited, controlled 69.8% of all tracked volume in September.
Key Findings
All figures below come from Tanzanite.xyz onchain deposit tracking across 41 centralized crypto casinos unless otherwise noted. September 2026 data.
- $48.8B tracked, $4.97B in September: Deposit volume across the 41 tracked casinos reached $48.8 billion over the trailing 12 months. September brought in $4.97 billion across 7.46 million deposits, up 15.2% by value and down 3.3% by count against a revised August. The average deposit rose from $559 to $665.
- BC Game rose 93%, almost all of it on Arbitrum: BC Game took $316 million, of which $137 million arrived as ARB tokens on Arbitrum and two wallets sent $131 million of that. Without Arbitrum it grew 12%. Duel's 52% rise to $387 million came on an almost flat deposit count and lifted it to third.
- 4,440 wallets control 69.8% of the market: Wallets above $100,000 were 0.34% of the 1.32 million that deposited in September, yet held 69.8% of all tracked volume, up from 64.7% in August. Only 450 sit above $1M, holding 48.7%. Concentration rose at 15 of the 21 operators we can compare month on month.
- Stablecoins are 73.3% of deposits but 57.2% of reserves: Tether, USDC and Dai made up 73.3% of September deposit volume and 57.2% of what casinos hold in their hot wallets. The gap narrowed from 20.4 points to 16.1. Ethereum is held at 1.6 times its deposit weight and Solana at 1.15 times.
- Ethereum leads Tron by $150M, BSC leads by count: Ethereum settled $1.65B against Tron's $1.50B, narrowing the gap from $250 million in August. BSC again processed the most deposits at 2.16 million, with Solana close behind at 2.06 million.
- Reserves fell 14%, almost all of it at Stake: The monthly timeseries puts the 41 operators at $338.7 million at the end of September, down from $395.2 million. Stake fell $47 million and StakeUS $8.9 million, while Rainbet added $5.1 million. Reserves now cover 6.8% of a month's deposits, near the bottom of their 12 month range.
- Onchain casinos shrank 29%: Solpump and Solpot took $10.4 million in bets during September and kept $447,000 in revenue, equal to 0.21% of centralized deposit volume. Solpot lost 89% of its active players in a month. Luck.io shut down in April 2026.
These are the headline numbers. The sections below break down the data behind each one: which operators are growing and which are losing share, how deposit value concentrates at the top of the curve, what currencies and blockchains players actually use, and what hot wallet balances reveal about operator liquidity.
Crypto Casino Operator Rankings by Deposit Volume
The rankings below are based entirely on onchain deposit volume tracked by Tanzanite.xyz. Deposit volume measures the total value of cryptocurrency transferred into each casino’s known wallet clusters. It is not gross gaming revenue or wager handle, both of which are multiples of deposits because players wager the same funds repeatedly.
Deposit Volume by Casino: Month on Month Movers
The table shows the top 15 operators by September deposit volume, each one’s market share, the change against August, and a three month rolling average. The rolling column matters more than the monthly one at this scale, because a single month at the tail of the market is often noise rather than direction.
| # | Casino | September Volume | Market Share | Change vs August | 3 Month Average |
|---|---|---|---|---|---|
| 1 | Stake | $2.26B | 45.5% | Up 7.6% | $2.18B |
| 2 | Roobet | $462.0M | 9.3% | Up 3.8% | $425.0M |
| 3 | Duel | $387.0M | 7.8% | Up 52.4% | $290.4M |
| 4 | Rainbet | $319.0M | 6.4% | Up 9.6% | $320.3M |
| 5 | BC Game | $316.0M | 6.4% | Up 92.7% | $204.0M |
| 6 | Gamdom | $241.0M | 4.9% | Up 26.8% | $202.0M |
| 7 | Shuffle | $209.0M | 4.2% | Up 4.5% | $204.4M |
| 8 | 1WIN | $143.0M | 2.9% | Up 27.7% | $118.7M |
| 9 | StakeUS | $98.3M | 2.0% | Down 3.6% | $96.1M |
| 10 | Sportsbet.io | $79.1M | 1.6% | Up 25.2% | $69.9M |
| 11 | Thrill | $48.4M | 1.0% | Down 4.7% | $51.5M |
| 12 | Winna | $46.1M | 0.9% | Up 26.6% | $40.3M |
| 13 | Cloudbet | $40.8M | 0.8% | Up 27.5% | $42.7M |
| 14 | BetFury | $40.4M | 0.8% | Up 129.5% | $25.1M |
| 15 | Yeet | $32.3M | 0.7% | Up 46.8% | $28.7M |
Stake remains the largest crypto casino by onchain deposit volume at $2.26 billion, a 45.5% market share. Its volume rose 7.6% while its deposit count fell 8.3% to 3.09 million, so the average Stake deposit rose from $623 to $731.
Measured by depositors rather than dollars, its lead is wider still. Wallet counts are the closest verifiable measure of crypto casino traffic, and Stake drew 774,000 depositing wallets in September, more than the next nine operators combined.
Stake’s pattern runs through the whole market this month. Across all 41 operators, volume rose 15.2% while deposit count fell 3.3%, and the average deposit climbed from $559 to $665. It is the reverse of August, when deposits got more frequent and smaller.
Roobet held second place at $462 million, up 3.8% on a deposit count up 2.6%. The large depositors who returned in August have stayed.
Volume tells you how much moved. Deposit count tells you how many people moved it. When one rises and the other falls, the casino has not changed size, it has changed customer.
BC Game is the month’s biggest mover, and most of the move arrived on one chain. Its volume rose 92.7% to $316 million, but $137 million of that came in as ARB tokens on Arbitrum, and two wallets sent $131 million of it. Strip out Arbitrum and BC Game grew 12%.
Two wallets sending $131 million in a month, mostly in deposits between $10,000 and $100,000, looks more like an operational flow than two players. Onchain data cannot confirm either reading, so we report the flow and not a motive.
Correction: the August edition reported BC Game falling 55.7% to $46.1 million. Tanzanite has since revised BC Game’s history and its August now reads $164 million, a 24% rise on July. It is the only revision we found when re-reading August deposit volume for all 41 operators.
Duel Casino is the cleaner growth story. Volume rose 52.4% to $387 million on a deposit count up just 2.1%, lifting it from fourth to third, and its average deposit grew from $1,054 to $1,573.
BetFury rose 129.5% to $40.4 million and Yeet 46.8% to $32.3 million, both entering the top 15, while Duelbits and Casinobet drop to 16th and 17th. Ten wallets above $1 million account for 64% of BetFury’s September volume. StakeUS and Thrill were the only top 15 operators to shrink, down 3.6% and 4.7%.
All 41 tracked operators recorded deposits in both months, so the all-operator total and the constant-panel total are the same figure this month at $4.97 billion. We publish both every month because Tanzanite’s coverage has expanded before, and when it does the two will diverge.
Other Tracked Operators (Ranks 16 to 41)
The remaining 26 operators processed $242 million between them in September, which is 4.9% of all tracked volume. The three month rolling column is the one to read here, because monthly swings at this scale are frequently noise.
| # | Casino | September Volume | Change vs August | 3 Month Average |
|---|---|---|---|---|
| 16 | Duelbits | $31.8M | Up 27.2% | $25.4M |
| 17 | Casinobet | $29.1M | Up 2.1% | $30.4M |
| 18 | Razed | $25.7M | Up 10.8% | $25.6M |
| 19 | ToshiBet | $25.0M | Up 334.0% | $12.5M |
| 20 | 500 Casino | $21.0M | Down 7.5% | $21.6M |
| 21 | MetaWin | $19.6M | Down 15.2% | $23.5M |
| 22 | Dicey | $17.4M | Down 2.2% | $17.3M |
| 23 | Gamba | $15.6M | Up 82.9% | $11.2M |
| 24 | Solcasino | $15.4M | Up 9.2% | $15.3M |
| 25 | ShuffleUS | $5.8M | Down 27.8% | $7.3M |
| 26 | CoinCasino | $5.0M | Down 26.1% | $6.2M |
| 27 | Housebets | $4.8M | Down 16.5% | $4.8M |
| 28 | Whale.io | $4.1M | Down 12.4% | $4.4M |
| 29 | Acebet | $3.8M | Down 27.8% | $5.2M |
| 30 | Degen City | $3.8M | Up 47.1% | $3.1M |
| 31 | Goated | $3.8M | Up 32.7% | $3.2M |
| 32 | Qzino | $3.2M | Down 11.0% | $3.4M |
| 33 | Spartans | $3.0M | Up 10.8% | $3.4M |
| 34 | Shock | $1.5M | Up 10.8% | $1.6M |
| 35 | Chips | $1.3M | Down 12.7% | $1.4M |
| 36 | Wager | $1.3M | Down 17.3% | $1.1M |
| 37 | Cybet | $293K | Down 46.8% | $499K |
| 38 | Jackpotbet | $216K | Down 26.0% | $278K |
| 39 | Flush | $97K | Up 26.6% | $118K |
| 40 | Rollbit | $1,040 | Down 100.0% | $21.3M |
| 41 | Bluff | $624 | Down 99.3% | $233K |
Two of the largest moves in this tier came from a handful of wallets. ToshiBet rose 334% to $25.0 million on a deposit count up just 5.8%, and three wallets above $1 million account for $19.1 million of it. Gamba rose 82.9% to $15.6 million, with three $1M+ wallets behind 79% of its volume.
Rollbit recorded 7 deposits worth $1,040 in September, against 31,900 worth $14.4 million in August. Its tracked hot wallets did not move, holding about $4.1 million on the monthly timeseries, which is not what a closing casino looks like.
The likelier explanation is that Rollbit now takes deposits through addresses Tanzanite does not yet track. We treat its September figure as a coverage gap rather than a collapse, and will report it as one until the data says otherwise.
Average Deposit Size: Whales vs Mass Market
Deposit volume alone does not reveal what kind of player a casino attracts. A $250 million month could come from 250 players depositing $1 million each or from a million players depositing $250. Dividing volume by deposit count separates the two.
The table covers the 24 operators above $10 million in September volume. Below that threshold, deposit counts are small enough that a handful of transactions distorts the average.
| # | Casino | September Volume | Deposits | Avg Deposit |
|---|---|---|---|---|
| 1 | Casinobet | $29.1M | 2.0K | $14,406 |
| 2 | Gamba | $15.6M | 1.7K | $9,398 |
| 3 | Sportsbet.io | $79.1M | 13.9K | $5,691 |
| 4 | Cloudbet | $40.8M | 10.9K | $3,743 |
| 5 | BC Game | $316.0M | 123.0K | $2,569 |
| 6 | Duel | $387.0M | 246.0K | $1,573 |
| 7 | Dicey | $17.4M | 14.5K | $1,200 |
| 8 | Gamdom | $241.0M | 217.0K | $1,111 |
| 9 | BetFury | $40.4M | 41.1K | $983 |
| 10 | ToshiBet | $25.0M | 25.6K | $977 |
| 11 | Yeet | $32.3M | 39.4K | $820 |
| 12 | Stake | $2.26B | 3.09M | $731 |
| 13 | Winna | $46.1M | 63.1K | $731 |
| 14 | Roobet | $462.0M | 701.0K | $659 |
| 15 | Duelbits | $31.8M | 49.2K | $646 |
| 16 | StakeUS | $98.3M | 178.0K | $552 |
| 17 | Razed | $25.7M | 47.9K | $537 |
| 18 | Shuffle | $209.0M | 553.0K | $378 |
| 19 | Thrill | $48.4M | 143.0K | $338 |
| 20 | MetaWin | $19.6M | 58.2K | $337 |
| 21 | 500 Casino | $21.0M | 65.5K | $321 |
| 22 | 1WIN | $143.0M | 470.0K | $304 |
| 23 | Rainbet | $319.0M | 1.07M | $298 |
| 24 | Solcasino | $15.4M | 62.3K | $247 |
The spread runs from $247 at Solcasino to $14,406 at Casinobet, a factor of 58 between two businesses described by the same two words.
Casinobet took $29.1 million across 2,020 deposits. Gamba averaged $9,398 and Sportsbet.io $5,691. At all three, a handful of wallets above $1 million account for most of the money, one at Casinobet, three at Gamba and four at Sportsbet.io.
Averages rose sharply this month. ToshiBet’s quadrupled from $238 to $977, and BetFury’s and BC Game’s more than doubled. In all three, deposit counts barely moved while volume surged, which is what a few very large depositors arriving looks like.
Duel’s average rose 49% to $1,573 and Sportsbet.io’s 58%, while Stake’s rose 17% to $731 on a deposit count down 8.3%. Dicey went the other way, falling 24% from $1,575 to $1,200 as its deposit count grew 28%. MetaWin fell 15% and 500 Casino 16%, on steady or rising counts.
The average deposit is the fastest way to see a whale arrive or leave. Volume moves, count holds, and the average shifts within a single month. It moved by 15% or more at sixteen of the 24 largest operators in September, and thirteen of those moves were upward.
Rainbet remains the mass market anchor at $298 across 1.07 million deposits, second only to Stake by transaction count. Our US Gambling Survey 2026 gives some sense of who those depositors are: 9% of Americans have used cryptocurrency to fund gambling, rising to 16.1% among 25 to 34 year olds.
Deposit Distribution: Where the Money Actually Sits
The average deposit is useful but it hides the extremes. Tanzanite splits every deposit into six size buckets, which shows how much of a casino’s volume arrives in small transactions and how much arrives in very large ones.
The table below covers the 24 operators above $10 million in September volume, sorted by the share of volume arriving in deposits over $100,000. Each row sums to 100% of that casino’s deposit volume.
| Casino | <$100 | $100 to $1K | $1K to $10K | $10K to $100K | $100K to $1M | $1M+ |
|---|---|---|---|---|---|---|
| Casinobet | 0.1% | 0.3% | 0.1% | 10.0% | 82.7% | 6.9% |
| Sportsbet.io | 0.2% | 1.5% | 3.3% | 11.1% | 70.0% | 13.9% |
| BetFury | 1.5% | 5.2% | 6.7% | 9.8% | 62.5% | 14.3% |
| Cloudbet | 0.2% | 2.5% | 8.8% | 22.7% | 65.8% | 0.0% |
| Roobet | 3.3% | 11.9% | 14.5% | 15.2% | 44.4% | 10.8% |
| Duel | 1.6% | 7.9% | 14.1% | 23.2% | 44.7% | 8.5% |
| Winna | 2.1% | 10.8% | 22.6% | 14.0% | 43.4% | 7.0% |
| Dicey | 1.0% | 2.9% | 10.7% | 36.0% | 49.4% | 0.0% |
| StakeUS | 3.0% | 22.1% | 25.0% | 3.2% | 15.3% | 31.4% |
| 1WIN | 4.0% | 12.6% | 21.1% | 16.1% | 27.4% | 18.9% |
| Stake | 2.0% | 12.3% | 20.7% | 20.7% | 20.7% | 23.5% |
| Gamdom | 1.3% | 11.6% | 18.3% | 24.7% | 33.1% | 11.1% |
| Gamba | 0.0% | 0.0% | 3.5% | 53.9% | 42.6% | 0.0% |
| Duelbits | 2.6% | 12.6% | 21.7% | 25.9% | 20.3% | 16.9% |
| Yeet | 2.0% | 9.5% | 23.2% | 31.3% | 34.1% | 0.0% |
| Razed | 2.8% | 16.1% | 22.4% | 27.8% | 30.9% | 0.0% |
| BC Game | 0.4% | 5.3% | 12.3% | 52.6% | 26.8% | 2.7% |
| Shuffle | 5.5% | 18.2% | 25.5% | 25.9% | 17.9% | 7.0% |
| Rainbet | 8.0% | 21.4% | 23.2% | 22.5% | 15.0% | 9.9% |
| Thrill | 5.3% | 19.7% | 29.1% | 29.8% | 16.2% | 0.0% |
| 500 Casino | 5.3% | 26.3% | 32.5% | 24.0% | 11.9% | 0.0% |
| MetaWin | 6.6% | 29.2% | 31.3% | 24.6% | 8.3% | 0.0% |
| Solcasino | 8.6% | 35.4% | 36.0% | 16.3% | 3.7% | 0.0% |
| ToshiBet | 1.4% | 6.6% | 12.2% | 79.3% | 0.4% | 0.0% |
Casinobet, Sportsbet.io and BetFury are the most top-heavy operators in the dataset. At Casinobet, 89.6% of volume arrives in deposits above $100,000 while deposits under $100 account for one tenth of one percent. Sportsbet.io reads 83.9% and BetFury 76.8%.
BetFury moved furthest. Its share of volume arriving in deposits above $100,000 rose from 41.3% in August to 76.8%, putting a $40 million casino behind only Casinobet and Sportsbet.io.
StakeUS still has the strangest profile. Its $1M+ bucket alone is 31.4% of volume, the highest of any tracked casino, yet 50.1% of its volume still arrives below $10,000 and just 3.2% sits between $10,000 and $100,000.
At the other end, Solcasino takes just 3.7% of its volume above $100,000 and MetaWin 8.3%. Rainbet still has the largest share of small deposits among the ten largest operators, with 8.0% of volume arriving under $100, though its $1M+ share rose from 3.5% to 9.9%.
What the same data looks like by transaction count
Volume share and transaction share describe completely different things, and the gap between them is the whole point of this section.
- Under $100: 64.9% of all deposits, carrying 2.6% of all volume. Roughly 4.46 million transactions in September.
- $100 to $1,000: 29.2% of deposits, 12.3% of volume. Together with the bucket above it, this is where almost every transaction happens.
- $100,000 and above: 0.08% of deposits, 43.1% of volume, up from 38.2% in August and above the trailing year's 41.0%. That is 5,344 transactions out of the 6.87 million the distribution panel counts, or one in every 1,285.
- $1 million and above: 313 transactions across the entire month, carrying 15.7% of all tracked deposit volume.
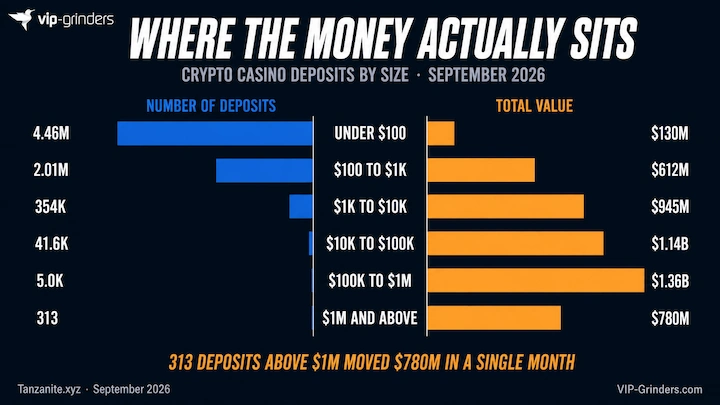
Three hundred and thirteen individual deposits moved $780 million into crypto casinos in September. That is nearly a sixth of the entire market, arriving in a number of transactions you could list on a single page.
Two thirds of crypto casino deposits are under $100, and those deposits carry 2.6% of the money. The industry describes itself as a mass market consumer business, and by transaction count that is true. By revenue it is something else entirely.
This is deposit-level concentration, measured one transaction at a time. It understates the real picture, because a wallet that deposits $50,000 twenty times does not appear in the $1M+ bucket at all.
ToshiBet shows it clearly this month. Just 0.4% of its volume arrived in single deposits above $100,000, yet three wallets sent it more than $1 million each in September. The next section measures the same market by wallet instead, and the answer is roughly three times more concentrated.
Wallet Concentration: How Few Wallets Drive Crypto Casino Volume
Every figure so far has measured individual deposits. This section measures wallets, meaning the total each depositing address sent to a casino across the whole month.
The distinction matters more than it sounds. A wallet that deposits $50,000 twenty times never appears in the $1 million bucket at deposit level, but at wallet level it is a million dollar depositor. Measuring one transaction at a time understates how concentrated this market actually is.
Across the 41 tracked casinos in September, 1.32 million wallets made 6.87 million deposits, an average of 5.2 deposits per wallet. Tanzanite’s wallet panel counts fewer deposits than its headline figure of 7.46 million, mostly because it leaves out near-zero transfers on Tron and XRP, a difference we explain in the methodology.
- 4,440 wallets held more than $100,000: That is 0.34% of every wallet that deposited, and they account for $3.46 billion, or 69.8% of all tracked volume.
- 450 wallets held more than $1 million: One wallet in every 2,928. They hold $2.42 billion between them, 48.7% of the market, averaging $5.38 million each.
- The other 99.66% of wallets share less than a third of the money: Roughly 1.31 million wallets deposited under $100,000 each, and together they account for 30.2% of volume.
- Concentration rose in September: Wallets above $100,000 held 69.8% of volume, up from 64.7% in August. Without BC Game's Arbitrum deposits the figure is still about 69%, so the rise is not one casino's doing.
The Crypto Casino Whale Index
The Whale Index ranks each casino by the share of its deposit volume that comes from wallets holding more than $100,000. It is a VIP-Grinders derived metric, calculated from Tanzanite wallet distribution data, and we publish it monthly.
The table covers the 24 operators above $10 million in September volume. Below that threshold a single wallet can swing the result, so those casinos are excluded rather than ranked misleadingly. The final column shows the change against August in percentage points.
| # | Casino | Whale Index | Deposit Level | vs August |
|---|---|---|---|---|
| 1 | Casinobet | 99.7% | 89.6% | +0.1 |
| 2 | Gamba | 99.4% | 42.6% | New |
| 3 | Sportsbet.io | 92.9% | 83.9% | +3.9 |
| 4 | ToshiBet | 85.3% | 0.4% | New |
| 5 | BetFury | 84.9% | 76.8% | +24.8 |
| 6 | BC Game | 82.3% | 29.5% | Revised |
| 7 | Dicey | 80.0% | 49.4% | -1.4 |
| 8 | Duel | 78.7% | 53.2% | +10.2 |
| 9 | Cloudbet | 76.1% | 65.8% | -3.9 |
| 10 | Roobet | 75.6% | 55.1% | -0.6 |
| 11 | Winna | 71.0% | 50.4% | +5.4 |
| 12 | Gamdom | 70.0% | 44.2% | +8.4 |
| 13 | Yeet | 69.1% | 34.1% | +9.9 |
| 14 | Stake | 69.0% | 44.2% | +3.3 |
| 15 | 1WIN | 68.5% | 46.3% | +6.2 |
| 16 | Duelbits | 61.0% | 37.2% | +10.2 |
| 17 | StakeUS | 59.1% | 46.7% | -1.9 |
| 18 | Razed | 56.2% | 30.9% | +2.3 |
| 19 | Shuffle | 56.1% | 24.9% | +2.1 |
| 20 | Rainbet | 55.3% | 24.9% | +4.5 |
| 21 | Thrill | 54.7% | 16.2% | +0.1 |
| 22 | MetaWin | 42.2% | 8.3% | -6.8 |
| 23 | 500 Casino | 34.8% | 11.9% | -7.1 |
| 24 | Solcasino | 29.9% | 3.7% | +0.7 |
The Whale Index column measures wallets. The deposit level column measures individual transactions, and it is there to show the gap.
Every casino is more concentrated at wallet level than at deposit level. The gap averages 28 points and runs from 8.1 at BetFury to 84.9 at ToshiBet. ToshiBet barely registers at deposit level, with 0.4% of volume above $100,000, and is 85% whale money once you total each wallet.
BC Game shows the same effect at scale. Its September deposits mostly arrived between $10,000 and $100,000, putting just 29.5% of volume above $100,000 at deposit level, against 82.3% at wallet level.
That gap is the reason deposit-level concentration figures published elsewhere understate this market. Whales do not send single seven-figure transfers. They accumulate seven-figure positions out of five-figure deposits.
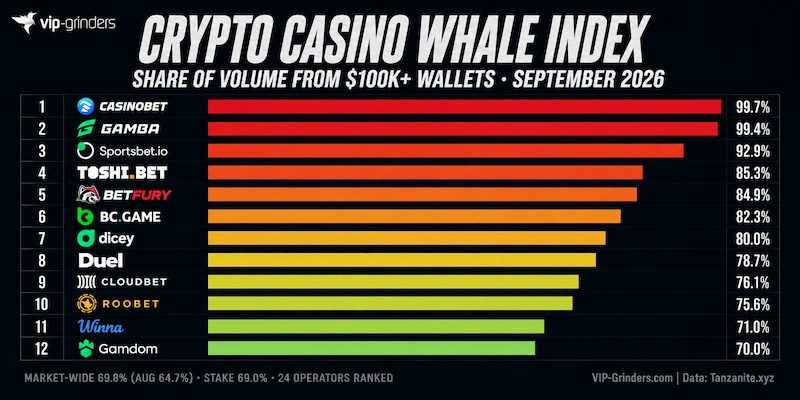
Concentration rose at 15 of the 21 operators we can compare with August. BetFury rose 24.8 points, Duel and Duelbits 10.2 each, Yeet 9.9 and Gamdom 8.4. The largest falls were at 500 Casino, down 7.1, and MetaWin, down 6.8.
BC Game is marked as revised because Tanzanite restated its August history after we published, so its August index no longer reflects the current data. ToshiBet and Gamba are new to the table, having been below $10 million in August.
Correction: the August edition compared each casino’s monthly index with its trailing 12 month figure and concluded that whale concentration was falling. That comparison was not like for like, because wallets are sorted by what each address sends across the whole period shown, so a year always looks more concentrated than a single month. We have withdrawn the claim and compare month with month from this edition on.
The mass market end barely moved. Deposits under $100 were roughly 65% of transactions across the trailing year and 64.9% in September. Everything happening in this market is happening at the top of the curve.
When 4,440 wallets out of 1.32 million control more than two thirds of the money, this is not a mass consumer market with a whale segment. It is a VIP business with a mass market front end. That has consequences for regulation, for marketing spend, and for how honest the industry is about who actually generates the revenue.
Some operators lean on whale money far less. Three of the 24 ranked operators take most of their volume from wallets below $100,000: MetaWin, 500 Casino and Solcasino. 500 Casino sits second from the bottom of the index at 34.8%, with just 11.9% of its volume arriving in single deposits above $100,000.
For players at the other end of that curve, our guide to high roller crypto casinos covers which operators actually cater to large deposits and what limits they run.
Which Cryptocurrencies Players Use
Tanzanite tracks 16 cryptocurrencies across all 41 casinos, measuring both deposit volume and deposit count. A currency can dominate by value while ranking far lower by transaction count, and that gap is the clearest signal of who uses it and why.
Stablecoins Control the Majority of Deposit Volume
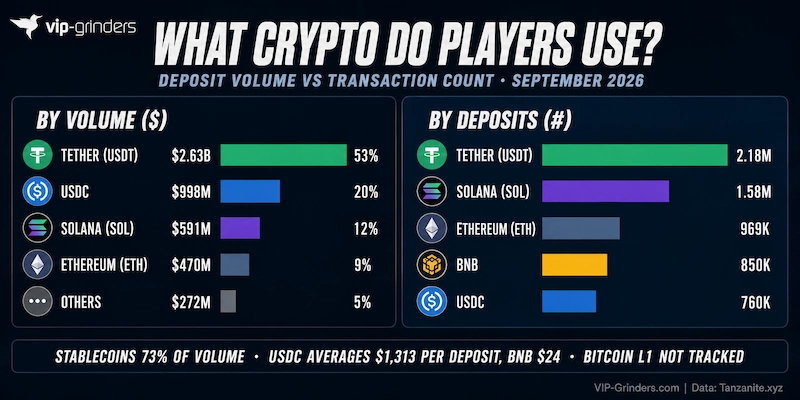
Tether and USDC together accounted for 73.1% of all deposit volume in September. Adding Dai takes the stablecoin share to 73.3%, down from 75.5% in August and now below the 73.8% it started the year at in October.
| Token | September Volume | Change vs August | Deposits | Avg Deposit |
|---|---|---|---|---|
| Tether | $2.63B | Up 8.7% | 2.18M | $1,206 |
| USD Coin | $998.0M | Up 20.7% | 760K | $1,313 |
| Solana | $591.0M | Up 20.9% | 1.58M | $374 |
| Ethereum | $470.0M | Up 13.5% | 969K | $485 |
| Arbitrum | $137.0M | Up 3,086% | 8.5K | $16,137 |
| XRP | $74.3M | Up 0.1% | 561K | $132 |
| Tron | $22.0M | Down 47.5% | 326K | $67 |
| BNB | $20.4M | Down 5.6% | 850K | $24 |
| Dai | $6.2M | Down 12.4% | 1.0K | $5,962 |
| Chainlink | $4.7M | Up 150.8% | 1.2K | $3,854 |
| TON | $3.2M | Down 10.1% | 106K | $30 |
| MATIC | $1.4M | Down 17.8% | 97K | $15 |
| Shiba Inu | $1.0M | Down 20.0% | 5.6K | $178 |
| Avalanche | $762K | Up 7.3% | 5.9K | $128 |
| TRUMP | $564K | Up 6.6% | 1.2K | $478 |
| Pepe | $8K | Up 12.7% | 96 | $85 |
USDC remains the year’s strongest performer, growing from $535 million in October to $998 million in September, a rise of 87%. It has held second place without interruption since March. Ethereum grew 13.5% in September to $470 million, back above its October level of $450 million.
Arbitrum went from $4.3 million to $137 million, almost all of it two wallets depositing ARB at BC Game. Without that increase, stablecoins would have held 75.3% of volume, so one flow explains most of the drop in their share. Solana grew 20.9% to $591 million, while Tron fell 47.5% to $22 million, the sharpest contraction of any major currency.
XRP was flat in September at $74.3 million, still 60% below its January peak of $188 million.
Bitcoin’s native blockchain is not tracked by Tanzanite, which covers 10 chains but not Bitcoin L1. BTC deposits sent on Bitcoin L1 are excluded from this dataset entirely. Wrapped BTC on Ethereum is included but is a small fraction, which means every stablecoin share figure on this page is overstated to an unknown degree.
This aligns with broader industry data. SOFTSWISS, drawing on more than 500 partner brands, reported Bitcoin’s share of crypto gambling bets falling more than 17 percentage points between 2023 and 2024, with Tether the largest gainer. An earlier SOFTSWISS report covering 700+ brands found that 35% of crypto casino players are women.
Deposit Count by Currency: Which Crypto Has the Most Transactions
Tether leads by transaction count as well as by value. Over the trailing 12 months it processed 22.0 million deposits against Solana’s 17.9 million, a gap of 23%.
The BNB anomaly from August has not gone away. BNB recorded 850,000 deposits in September, down 15.8% but still fourth among all tokens by transaction count, while carrying 0.4% of volume at an average of $24.
- Tether: 2.18 million deposits in September at an average of $1,206. High value players moving significant funds in stablecoin form.
- Solana: 1.58 million deposits at an average of $374. Mass market players depositing often on a chain with sub-cent fees.
- USDC: 760,000 deposits at $1,313, the highest average of any major token. USDC depositors still move more per transaction than Tether depositors.
- BNB: 850,000 deposits at an average of $24. Only MATIC averages less among tracked currencies.
USDC has now led Tether on value per deposit for two editions running, at $1,313 against $1,206 in September. Tether narrowed the gap, with its average up 17% on August against 6% for USDC.
Deposit Size by Currency: Which Tokens Whales Use
Applying the same wallet analysis to currencies rather than casinos answers a question the volume table cannot. Stablecoins dominate this market, but that is a result rather than an explanation. The distribution data shows why.
The table covers the eight tokens above $10 million in September volume, ranked by the share of volume held in wallets above $100,000.
| Token | Wallet Level | Deposit Level | $1M+ Wallets |
|---|---|---|---|
| Arbitrum | 99.0% | 19.0% | 2 |
| USD Coin | 74.1% | 52.4% | 118 |
| Tether | 72.2% | 46.0% | 246 |
| XRP | 65.0% | 7.7% | 10 |
| Ethereum | 58.1% | 41.4% | 34 |
| Solana | 49.9% | 27.2% | 42 |
| BNB | 35.9% | 26.6% | 1 |
| Tron | 33.7% | 26.7% | 2 |
Stablecoins are the whale rails. USDC holds 74.1% of its volume in wallets above $100,000 and Tether 72.2%. Solana sits at 49.9% and Tron at 33.7%.
Arbitrum tops the table at 99.0%, but that is two wallets and one casino, covered in the rankings above. It describes a single flow, not how ARB holders behave.
The concentration is extreme at the very top. 246 Tether wallets hold $1.32 billion and 118 USDC wallets hold $512 million. Between them, 364 wallets account for 37% of everything deposited across the tracked market in September.
That reframes the stablecoin story. The usual explanation is that players prefer a dollar peg because it removes price volatility, which is true and also incomplete. Stablecoins are 73% of deposit volume largely because whales use them, and whales are more than two thirds of the market.
When transaction counts mislead
BNB recorded 828,000 deposits under $100 in September, carrying $1.67 million between them. That is an average of $2.02 per deposit, and they came from 386,000 separate wallets.
That works out at 2.1 deposits per wallet. For comparison, sub-$100 depositors average 2.8 deposits per wallet on Tether, 4.4 on Ethereum and 8.6 on Solana.
Tron shows a second version of the same problem. Its headline count of 326,000 deposits includes roughly 236,000 near-zero transfers that the distribution panel leaves out, so Tron’s 16.8% rise in deposit count says nothing about players.
The BNB pattern has now held for two months: hundreds of thousands of wallets each sent one or two transactions worth about two dollars and stopped, which looks like airdrop farming, faucet activity or automated wallets rather than gambling. Those transfers are 12.1% of the deposits the distribution panel counts but 0.03% of the volume, so we report them and keep them out of any reading of player behavior.
Strip those transfers out and the September market processed 6.04 million deposits rather than 6.87 million on the panel’s count. Every volume figure on this page is unaffected.
Transaction counts are the easiest number in this industry to inflate and the hardest to interpret. One million deposits averaging two dollars is not a million players. This is why we publish volume, count and wallet data side by side rather than picking whichever tells the better story.
Blockchain Networks Powering Crypto Gambling
Tanzanite tracks deposits across 10 blockchain networks. The distinction between a token and a chain matters throughout this section. Tether is a token that runs on several chains, so a player can deposit USDT via Ethereum, Tron, Solana or BSC, and the chain figures count the network carrying the transaction rather than the asset being sent.
Chain totals are therefore at least as large as the token of the same name, and usually much larger. Ethereum the chain settled $1.65 billion in September, while Ethereum the token accounted for $470 million.
| Chain | September Volume | Change vs August | Deposits | Avg Deposit |
|---|---|---|---|---|
| Ethereum | $1.65B | Up 7.1% | 1.46M | $1,130 |
| Tron | $1.50B | Up 16.3% | 669K | $2,242 |
| Solana | $935.0M | Up 24.2% | 2.06M | $454 |
| BSC | $498.0M | Down 0.6% | 2.16M | $231 |
| Arbitrum | $140.0M | Up 1,532% | 14K | $10,294 |
| Polygon | $127.0M | Up 32.8% | 259K | $490 |
| XRP | $74.3M | Up 0.1% | 561K | $132 |
| Base | $29.5M | Down 15.0% | 136K | $217 |
| TON | $5.4M | Down 12.9% | 132K | $41 |
| Avalanche | $1.3M | Down 0.8% | 7.7K | $164 |
Ethereum and Tron: The Two Largest Settlement Chains
Ethereum settled $1.65 billion in September against Tron’s $1.50 billion. Ethereum has led for three consecutive months, but the gap narrowed from $250 million in August to $150 million as Tron grew 16.3% against Ethereum’s 7.1%.
The lead has changed hands four times across the last 12 months. Tron was ahead in January and February, and again in May and June. Ethereum has held it since July.
Tron peaked at $1.70 billion in January and is now 12% below that level. Its headline deposit count rose 17.8% to 669,000, but roughly 237,000 of those are the near-zero transfers described in the currency section.
That leaves Tron with the highest average deposit of any major chain at $2,242, double Ethereum’s $1,130. Strip out the near-zero transfers and it rises to $3,468. The 2,249 Tron deposits above $100,000 carried 55.8% of everything the chain settled.
Tron was never a mass market chain. It is where large stablecoin transfers settle, because fees are low and confirmation is fast, and the wallet data supports that reading: 133 wallets hold 61.8% of all Tron volume.
Between them the two chains carry 64% of the market, down from 72% in October as Solana, BSC and Polygon absorbed share.
Which Blockchain Processes the Most Casino Deposits
Volume and transaction count give completely different answers. BSC processed 2.16 million deposits in September, more than any other chain, ahead of Solana at 2.06 million and Ethereum at 1.46 million.
BSC kept the lead it took in August, but only just. Its count fell 17.9% as the BNB dust event shrank, while Solana’s rose 5.1%, cutting the gap from 670,000 deposits to about 100,000.
The dust is still there. BNB’s 828,000 deposits under $100, at about $2 each, make up 38% of BSC’s count.
BSC carries 37.6% of every sub-$100 deposit in the entire tracked market. At a $231 average it remains the low-value rail regardless of the dust.
Solana is the mass market chain by any honest reading. It settled $935 million across 2.06 million deposits at a $454 average, with 28.4% of its volume arriving above $100,000, the second lowest of any major chain after BSC.
Smaller Networks: Base, Polygon, Arbitrum and TON
Arbitrum is the month’s outlier. It settled $140 million in September against $8.6 million in August, far above any previous month in our series, and two wallets account for 93% of it.
Base fell 15.0% to $29.5 million and now sits 55% below its March peak of $65 million. It has fallen or held flat in every month since that peak.
Polygon grew 32.8% to $127 million and is now within 9% of its July peak. TON fell 12.9% to $5.41 million after peaking in August.
Deposit Size by Chain: Settlement Rails and Retail Rails
Applying the wallet analysis to chains splits the ten networks into two clear groups.
- Settlement rails: Tron holds 61.8% of its volume in wallets above $1 million, Ethereum 49.5%. Between them 318 wallets account for 55% of what the two largest chains carry.
- Retail rails: Solana holds 33.9% in $1M+ wallets and BSC carries 37.6% of every sub-$100 deposit in the market. These are the chains where ordinary players actually transact.
- Reserves follow a different logic: Tron carries 30.2% of deposit volume but holds only 15.0% of casino reserves. Money arrives on Tron and leaves almost immediately.
Casino Financial Health: Hot Wallet Balances
Tanzanite tracks the value of cryptocurrency held in each casino’s known hot wallet addresses across all ten chains. Hot wallet balances are not total company reserves. They are the funds an operator keeps immediately available for player withdrawals and day to day liquidity.
A casino with high deposit volume and low visible reserves may simply be sweeping funds to cold storage quickly. Neither pattern is inherently good or bad. What the data shows clearly is the direction each operator is moving.
Hot Wallet Balances by Casino
The 41 tracked operators hold $389.5 million in visible hot wallet balances on Tanzanite’s live snapshot, taken on 1 October, which is the source for every figure in this table. That is down from $483 million on the August snapshot.
The monthly timeseries used in the trend section below reads $338.7 million at the end of September, and operator balances differ between the two. The top five account for $251 million of the snapshot total, and the bottom 20 hold $13.1 million between them.
| # | Casino | Balance | September Deposits | Balance as % of Deposits | Chains |
|---|---|---|---|---|---|
| 1 | Rainbet | $93.9M | $319.0M | 29.4% | 8 |
| 2 | Stake | $62.3M | $2.26B | 2.8% | 6 |
| 3 | BC Game | $35.6M | $316.0M | 11.3% | 10 |
| 4 | Roobet | $35.3M | $462.0M | 7.6% | 7 |
| 5 | 1WIN | $23.9M | $143.0M | 16.7% | 8 |
| 6 | Shuffle | $23.6M | $209.0M | 11.3% | 8 |
| 7 | StakeUS | $18.9M | $98.3M | 19.2% | 6 |
| 8 | Duel | $15.8M | $387.0M | 4.1% | 8 |
| 9 | Cloudbet | $13.6M | $40.8M | 33.3% | 10 |
| 10 | Duelbits | $7.19M | $31.8M | 22.6% | 5 |
| 11 | Solcasino | $7.15M | $15.4M | 46.4% | 10 |
| 12 | BetFury | $6.46M | $40.4M | 16.0% | 9 |
The percentage column is a liquidity ratio, not a solvency measure. It shows how much sits in trackable wallets against how much flowed through that casino during the month.
Rainbet now holds the largest balance at $93.9 million, 29.4% of its September deposits. Stake’s snapshot balance fell from $155 million to $62.3 million, spread across six chains, which is just 2.8% of its monthly deposit flow.
The ratio rises sharply further down the table. Solcasino holds 46.4% of a month’s deposits, Cloudbet 33.3% and Duelbits 22.6%. Smaller operators keep proportionally more of their flow visible onchain, which is what you would expect from businesses without established cold storage operations.
BC Game, Cloudbet, Solcasino and ToshiBet hold reserves across all ten tracked chains. Dicey holds across two.
Duelbits was hacked for about $7 million on 24 September, with attackers draining its hot wallets on at least four chains. Its balance on the monthly timeseries fell 37% in September to $2.24 million, yet the live snapshot on 1 October reads $7.19 million, most of it in ETH. The two sources disagree too widely for us to say how far its wallets have been refilled.
Reserve Trend: How Casino Balances Have Moved
Every figure in this section comes from the monthly timeseries rather than the live snapshot used in the table above, so operator balances here will not match it.
Across the 41 operators, visible reserves fell 14% in September, from $395.2 million to $338.7 million, leaving them 6% above their October level of $319.6 million. The low point was November at $251.8 million and the peak was $400.4 million in early July.
Measured against deposit flow, reserves have run between 6.25% and 9.98% of monthly deposit volume across the year. They now sit at 6.8% on the timeseries basis, near the bottom of that range, because deposits rose 15% while balances fell.
The same ratio on the snapshot reads 7.8%. That ratio is the cleanest single indicator of market-wide liquidity and we will track it every month.
Almost all of the fall was Stake. It ended September at $126 million, down $47 million from August’s series high of $173 million, and StakeUS fell $8.9 million to $18.6 million. 1WIN eased to $14.9 million, still the largest proportional build of any tracked operator since October’s $759,000.
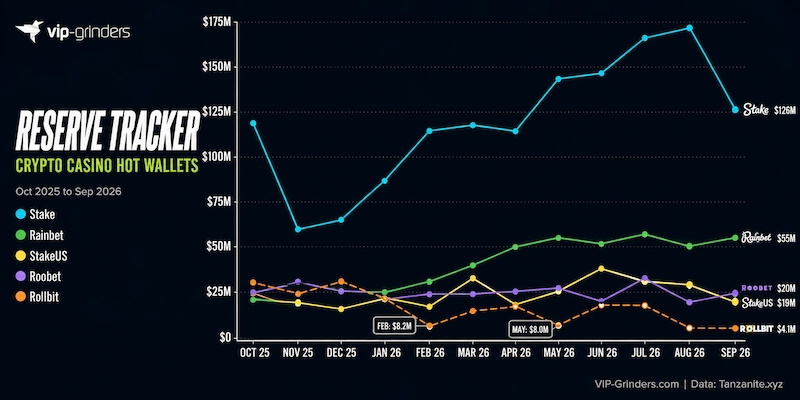
Rainbet rose 10.3% to $54.7 million, just below its July peak of $56.7 million. Roobet edged up to $20.0 million but remains 18% below its October level.
Rollbit: how a reserve drawdown looks onchain
Rollbit held $28.9 million in October and $4.10 million at the end of September, a fall of 86%. The path there matters more than the endpoint.
Its balance dropped below $10 million in three separate windows. Twice it recovered fully, from $8.24 million in February back to $21.0 million by April, and from $8.04 million in May back to $17.3 million by July.
The third drawdown has stopped deepening. Rollbit’s balance held at $4.1 million through September while its tracked deposits fell to seven, which looks more like a change in how it routes deposits than a run on its wallets. The live snapshot reads just $161,000, so we treat both Rollbit figures with caution until the two sources agree again.
Reserve Composition: What Casinos Actually Hold
Knowing how much a casino holds is one question. What it holds is a different one, and the answer is not what the deposit data would lead you to expect.
Players deposit stablecoins. Casinos do not hold them in the same proportion. Tether, USDC and Dai account for 73.3% of September deposit volume and 57.2% of hot wallet reserves, a gap of 16.1 points, down from 20.4 in August.
| Token | Share of Reserves | Share of Deposits | Ratio |
|---|---|---|---|
| Tether | 30.8% | 53.0% | 0.58x |
| USD Coin | 24.8% | 20.1% | 1.23x |
| Ethereum | 15.2% | 9.5% | 1.60x |
| Solana | 13.6% | 11.9% | 1.15x |
| XRP | 3.2% | 1.5% | 2.11x |
| BNB | 3.7% | 0.4% | 9.11x |
| Dai | 1.6% | 0.1% | 12.58x |
| Tron | 2.2% | 0.4% | 5.05x |
Tether is 53.0% of what arrives and 30.8% of what is held. Ethereum and Solana run the other way, held at 1.60 and 1.15 times their deposit weight.
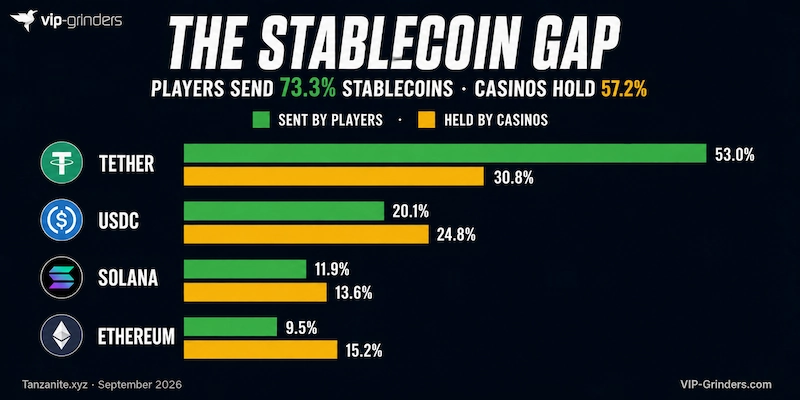
A player who deposits USDT is owed dollars. If an operator converts that into ETH or SOL and the market falls 20%, the liability does not move and the asset covering it does. That is an unhedged position on money the casino does not own.
This is not evidence of wrongdoing and it may well be deliberate treasury policy. It is a risk that has never been measurable before, and it now is.
The spread across operators is wide. Duelbits holds just 14.4% of its balance in stablecoins, most of the rest in ETH, and BC Game 24.9%, with $7.4 million in SOL, $6.7 million in ARB and $5.2 million in BNB. StakeUS reads 55.5% and Stake 60.8%, while at the other end 1WIN holds 87.7%, Roobet 75.3% and Razed 74.1%.
BC Game’s ARB position is 97.5% of all ARB held across tracked hot wallets, the reserve side of the Arbitrum deposits described in the rankings.
Nearly three quarters of the money arriving at crypto casinos is dollar-pegged. Just over half of what they hold against it is. Nobody in this industry publishes that comparison, and it is the single most useful thing onchain data can tell you about operator risk.
Chain Diversification: Where Reserves Actually Sit
Reserves concentrate differently from deposits. Ethereum holds 29.6% of all tracked balances, Solana 22.9%, Tron 15.0% and BSC 13.0%.
Tron is the outlier and it confirms what the deposit data showed. It carries 30.2% of deposit volume and holds 15.0% of reserves, equal to just 3.9% of a single month’s flow on that chain. Money arrives on Tron and leaves almost immediately.
Ethereum holds 7.0% of its monthly flow, Solana 9.5% and BSC 10.2%. Polygon holds 22.3% and XRP 16.5%, both far above their deposit weight, which is what a chain used for storage rather than settlement looks like.
Three individual positions stand out. BC Game holds $6.97 million on Arbitrum, 60% of every Arbitrum reserve in the tracked market, and Rainbet holds $11.6 million on Base, 67% of that chain’s total. 1WIN holds $1.52 million on TON, 46% of the market total, consistent with a Telegram-facing operation.
Centralized vs Fully Onchain Casinos
Tanzanite tracks three fully decentralized onchain casinos alongside the 41 centralized operators. These run entirely on Solana smart contracts, so players interact with the protocol directly rather than depositing into a company wallet, and game outcomes, payouts and house revenue are all verifiable onchain in real time.
Two of the three are still operating. Luck.io shut down in April 2026.
Onchain Casino Performance: Bet Volume, GGR and Players
| Casino | September Bet Volume | Change vs August | September GGR | Implied House Edge | Active Players |
|---|---|---|---|---|---|
| Solpump | $9.6M | Down 28% | $408K | 4.25% | 10.0K |
| Solpot | $784K | Down 37% | $39K | 5.00% | 1.7K |
The sector is smaller than a rounding error. Combined September bet volume across both surviving platforms was $10.4 million against $4.97 billion in centralized deposits, and bet volume is handle rather than deposits, so the real gap is wider still. Stake alone processed 217 times the sector’s entire monthly wagering.
What happened here is not that decentralized gambling failed everywhere at once. One platform was the sector, and it stopped.
Luck.io accounted for 74% of trailing-year bet volume and 60% of gross gaming revenue before it shut down. Strip it out and the two survivors did $218 million across the year, an average of $18.2 million a month.
Both remaining platforms shrank in September. Solpump fell 28% with GGR down 23%, and now sits at 64% of its twelve month average. Solpot fell 37% across bet volume and revenue, and its bet count halved.
Solpot’s player count is the strangest number in the section. It fell 89% to 1,680, yet those who stayed placed 86 bets each at an average of $5.44, against 19 bets at $4.30 in August. That looks like a large group of one-off accounts disappearing rather than regular players leaving, and Solpump, with 10,000 players placing 59 bets each at $16.21, saw no such drop.
The house edge data supports one clear conclusion. Across the trailing year, Luck.io ran an implied edge of 2.81% against Solpump’s 5.24% and Solpot’s 4.99%.
The platform that charged players the least is the one that no longer exists. That is not proof of causation, but a protocol taking roughly half what its competitors take, with no marketing arm and no balance sheet behind it, has very little room when volume falls.
A sector that loses three quarters of itself when one smart contract stops is not a market. It is a proof of concept with a single point of failure, and that is the more interesting finding than any growth rate.
How Big Is the Crypto Casino Market?
There is no audited figure for the size of the crypto gambling market, and the two most cited revenue estimates disagree by a factor of eight. That gap is not a rounding error. It is the result of different sources measuring different things and the results being repeated under the same label.
Why Published Market Sizes Range from $250M to $81B
The most widely cited number is $81.4 billion in gross gaming revenue for 2024, produced by Yield Sec and reported by the Financial Times in April 2025. It has since been repeated by Cointelegraph, Forbes, SiGMA World and dozens of others, almost always described as crypto casino revenue.
It does not measure crypto casinos. In July 2026, Gambling Insider put the figure to Yield Sec founder Ismail Vali, who confirmed it bundles crypto sports betting, crypto prediction markets and financial products alongside casino. The casino-only component is roughly $48 billion.
The prediction market component is substantial and growing. Our monthly Prediction Markets Report tracked a record $76.46 billion in event contract trading volume in September 2026 across 10 platforms, though notional trading volume and gross gaming revenue are not comparable measures.
The full workings have never been published, so there is no model to inspect and no wallet set to reproduce. Yield Sec stands by the number.
| What Is Being Measured | Source | Figure | Basis |
|---|---|---|---|
| All crypto gambling GGR, all verticals | Yield Sec / Financial Times | $81.4B (2024) | Estimated, methodology unpublished |
| Crypto casino GGR only | Yield Sec, via Gambling Insider | ~$48B (2024) | Casino component of the above |
| Crypto casino GGR | Tanzanite.xyz | $10B to $11B (2024) | Onchain, 20 casinos, 90+ wallets |
| Crypto casino deposits | Gambling Insider | $22.7B (2025) | Onchain, 12 casinos, 29 wallets |
| Crypto casino deposits | This report | $48.8B (trailing 12 months) | Onchain, 41 casinos |
| Crypto share of operator bet volume | SOFTSWISS, 700+ brands | 30% (Q1 2023) | Observed at partner operators |
| Crypto casino B2B software market | Business Research Insights | ~$13B | Vendor revenue, not player facing |
| Crypto gambling market, undefined | Blockonomi | $250M (2024) | No source or method given |
The $250 million figure at the bottom of that table and the $81.4 billion at the top are 326 times apart. The smaller one comes from a statistics roundup that gives no source or method, and it is less than BC Game alone took in deposits in September. Neither describes what most people mean by the crypto casino market.
What our own data implies
The industry convention for converting deposits into revenue is the ratio published by Tanzanite, derived from Stake’s publicly observable figures: roughly 37 cents of gross gaming revenue per dollar deposited.
Applied to the $48.8 billion this report tracks across 41 operators, that implies $18.1 billion in trailing 12 month gross gaming revenue, an average of $1.5 billion a month.
That sits between Tanzanite’s $10 to $11 billion for 2024 across 20 casinos and Yield Sec’s $48 billion casino-only component. Our operator coverage is 3.4 times Gambling Insider’s and our deposit total is 2.15 times theirs, which is what you would expect from tracking 41 casinos rather than 12.
The $81.4 billion figure has been repeated for eighteen months as crypto casino revenue. It was never that. Every number in this report can be checked against a public blockchain, which is the only real answer to a market where the headline figure came from a model nobody has seen.
The Broader Online Gambling Context
Surgence Labs puts global online gambling gross gaming revenue, across every vertical and every currency, at around $103 billion for 2025. If crypto gambling alone were $81.4 billion, crypto would account for around 79% of all online gambling worldwide, which nobody in the industry believes.
Our implied figure of $18.1 billion would put crypto casinos at roughly 17.5% of the global online gambling market. That sits below the 30% of bets SOFTSWISS recorded in crypto across 700+ partner brands in early 2023, and above the 6% to 12% Surgence Labs estimates.
| Metric | Estimate | Forecast | Source |
|---|---|---|---|
| Total online gambling | $88.0B (2025) | $202.8B by 2033 | Grand View Research |
| Total online gambling | $120.35B (2026) | $211.99B by 2031 | Mordor Intelligence |
| Total gambling, online and offline | $456.71B (2025) | $633.99B by 2030 | Mordor Intelligence |
For a full breakdown of how crypto fits within the wider casino sector, see our Casino Statistics 2026 overview.
One further check on the size of the long tail. Gambling Insider examined five smaller crypto casinos and found they took $151 million combined across 2025, less than one percent of Stake alone.
The case for the largest estimates rests on tens of thousands of small operators making up the difference. If a typical tail casino handles tens of millions a year rather than billions, that arithmetic does not work.
Regulation Reshaping the Crypto Casino Market
Six regulatory developments are changing how crypto casinos operate, where they can advertise and which players they can serve. The pace picked up sharply through 2026. Curaçao completed its licensing overhaul, the number of US states banning sweepstakes casinos rose to fourteen, the UK nearly doubled its tax on online casino revenue, and Brazil ordered its licensed online market shut.
Almost none of it is visible in the deposit data yet. Where it is, we say so.
Curaçao’s LOK Transition: New Licensing Standards
Most of the casinos tracked in this report operate under Curaçao jurisdiction. For decades that meant four private master license holders issuing sub-licenses with minimal oversight, and an operator could go live for little more than a registration fee.
That system no longer exists. The National Ordinance on Games of Chance, known as the LOK, came into force on 24 December 2024. The last master license expired at the end of January 2025, and the Curaçao Gaming Authority now issues every license directly as an independent public body.
- KYC and AML are mandatory: Operators must run identity verification, transaction monitoring and chain analysis tools for blockchain payments. Anonymous crypto platforms are rejected outright.
- Local substance required: Licensees must build real presence on the island, with local staff and decision making rather than a letterbox company. In January 2026 the CGA postponed enforcement of that rule to 1 April 2027.
- The old seals are gone: The last master licenses expired in January 2025 and the legacy orange seals expired permanently in October 2025. Every operator now holds a direct CGA license recorded in a public register.
- Territory restrictions are the operator's problem: The new law restricts service to a defined country list, and enforcement sits with each licensee rather than a master holder. Affiliates without geo-targeting built into their tracking are exposed alongside the operator.
- October 2026 terms deadline: New transparency rules require terms and conditions to be readable, reachable within one click on every platform, and consistent with actual business practice.
The transition is largely complete. Stake and Cloudbet hold direct CGA licenses, while BC Game left Curaçao in December 2024 and now operates under an Anjouan license. Yolo Group, parent of Sportsbet.io, said in September 2025 it would leave grey markets and fold Sportsbet.io and Bitcasino into a single regulated brand, with their Curaçao licenses expected to be wound down.
In June 2026 the CGA published crypto-specific rules covering wallet segregation, transaction monitoring and blockchain-based AML, with a mid-2027 implementation deadline.
A year earlier, in July 2025, the regulator began issuing cease and desist notices to Curaçao-registered companies operating under foreign licenses, closing a workaround where companies incorporated locally to imply CGA oversight they did not have.
In September the regulator’s own files became the story. A security researcher accessed the CGA’s licensing portal, and from 22 September the Dutch outlet Follow the Money and partner newsrooms in Germany, Norway, Sweden and Austria began publishing what the files show about roughly 650 licensed companies and 800 owners. The CGA called the access a serious breach and acknowledged it had granted some licenses while ownership questions were still open, citing the transition to the new law.
Stake’s operating company, Medium Rare N.V., is one of those cases. According to the leaked files as reported by Follow the Money, regulators questioned whether its registered owner was the sole owner, given large loans and payments to entities linked to Stake’s publicly known founders, and licensed it while that review was unresolved. No license has been suspended as a result so far.
For players, a Curaçao license still carries more weight than it did two years ago, though the leak shows how much ownership checking was unfinished when licenses were issued. For operators, the cost of holding one has risen, and some have chosen Anjouan instead, a jurisdiction with far less regulatory infrastructure behind it.
US Sweepstakes Casino Crackdown Escalates
Sweepstakes casinos use dual-currency models to sit between social gaming and real money gambling. States have spent 2025 and 2026 closing that gap, and the count has moved well past where it stood at the start of the year.
- Ten states have passed explicit statutory bans: California, Connecticut, Indiana, Louisiana, Maine, Montana, New Jersey, New York, Oklahoma and Tennessee. Idaho, Michigan, Nevada and Washington block operators under existing gambling law.
- Louisiana went furthest: From 1 August 2026, dual-currency sweepstakes are treated as gambling by computer and added to the definition of racketeering. Maximum fines rose from $20,000 to $100,000 with up to five years in prison.
- Liability now extends past the operator: The Louisiana statutes name platform providers, suppliers, geolocation providers, promoters and media affiliates. Anyone knowingly helping run the games is in scope.
- Enforcement powers are being handed to regulators: Iowa gave its Racing and Gaming Commission cease and desist and injunctive powers from 1 July 2026. Oklahoma's ban takes effect 1 November 2026 after a veto override.
The Louisiana provision naming media affiliates is the one worth watching. Most sweepstakes legislation targets operators and payment processors. Extending liability to anyone knowingly promoting the games changes the risk calculation for publishers, affiliates and advertising networks in a way the earlier state bans did not.
Enforcement has also moved up the supply chain. A Los Angeles lawsuit named game suppliers Evolution, Pragmatic Play and Hacksaw Gaming as co-defendants alongside the operator of Stake.us. A New York case named Coinbase as a payment facilitator.
In August 2025 all 50 state attorneys general asked the Department of Justice to step up enforcement against illegal offshore gambling.
Florida took the most direct action yet against a crypto operator. In August its attorney general sued Stake and VGW, along with payment processors for both. In late September he wrote to Google, Meta, Reddit, Snap and TikTok demanding written confirmation by 23 October of the steps they have taken to stop advertising sweepstakes casinos, Stake among them, to Florida residents.
The deposit data may be starting to show it. StakeUS took $98.3 million in September, down 3.6% on August, while its deposit count fell 19.1%. Its snapshot reserves fell from $42.1 million to $18.9 million.
UK Remote Gaming Duty Rose to 40%
The UK’s Remote Gaming Duty rose from 21% to 40% of gross gaming yield on 1 April 2026, close to a doubling and the largest change to British gambling taxation in years. A further remote betting duty of 25% follows in April 2027.
The detail that matters for crypto casinos is that the duty follows the customer rather than the license. Where an operator is incorporated makes no difference: if the player usually lives in the UK, the duty applies.
That cuts both ways. It removes the offshore arbitrage that a crypto-native operator might otherwise exploit, and it squeezes margins hard enough at licensed operators that some UK players have started looking at platforms outside the licensing system entirely.
Brazil Banned Crypto Payments for Gambling
Brazil’s regulated online betting market launched on 1 January 2025 under Normative Ordinance No. 615/2024, which explicitly prohibits cryptocurrency as a payment method. All deposits and withdrawals had to move through institutions authorized by the Central Bank of Brazil.
The direct volume impact was small. H2 Gambling Capital estimated crypto accounted for only 0.7% of Brazilian gambling transactions before the crypto ban. Brazil chose to exclude crypto entirely rather than regulate it alongside fiat, in one of the largest gambling populations in the world.
That regulated market is now being shut down. On 25 September President Lula signed a provisional measure banning fixed-odds sports betting and online casino games, with deposits stopped on publication, withdrawals allowed until 5 October and sites blocked from 6 October. Congress has 120 days to approve it or the measure lapses.
While it stands, Brazilian players have no licensed online option, only the offshore sites, crypto casinos among them, that the regulated market was built to replace. Tanzanite data does not show where depositors live, so we cannot yet measure whether that demand moves to the casinos tracked here.
Google Reclassified Crypto Wagering as Real Money Gambling
In October 2025 Google updated its Gambling and Games advertising policy, reclassifying sweepstakes casinos as real money gambling and extending the definition to games using virtual currencies with real world value.
That brought crypto casino advertising under the same rules as traditional online casinos. Operators must hold valid licenses in the markets they target, and ads are blocked where online gambling is prohibited.
The effect was to push acquisition spend toward channels Google does not control: influencer partnerships, Telegram, X and affiliate networks. Operators with their own distribution absorbed it more easily, which is part of why the Stake founders’ ownership of Kick matters commercially.
Offshore Crypto Casinos Face US Legal Action
Beyond the sweepstakes bans, multiple states have filed or are preparing action against offshore crypto casinos serving US residents without local licenses. The legal theory is straightforward: accepting deposits from a state where unlicensed online gambling is illegal breaks that state’s law regardless of where the company sits.
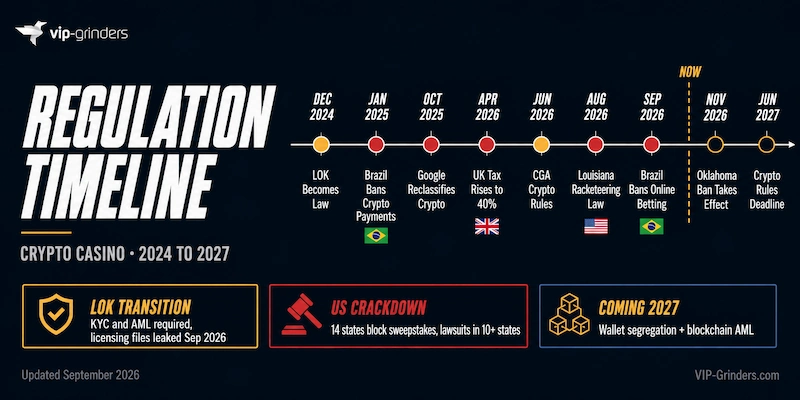
Class actions against Stake.us have been filed in at least nine states, alleging the sweepstakes model constitutes illegal gambling and that players can recover losses. A ruling in any one of them would set a precedent for every similar platform.
Geo-blocking is a weaker defense than it was, because the actions increasingly target payment processors and game suppliers rather than only the platform.
FAQs
What is the biggest crypto casino?
Based on onchain deposit data tracked by Tanzanite.xyz, Stake is the largest crypto casino by a wide margin. It took $2.26 billion in deposits during September 2026, a 45.5% market share across 41 tracked operators, from 774,000 depositing wallets. Over the trailing 12 months Stake processed $23.7 billion across 31.5 million deposits. Roobet ranks second at $462 million in September, ahead of Duel at $387 million and Rainbet at $319 million. Rainbet holds the largest visible hot wallet balance at $93.9 million, ahead of Stake at $62.3 million.
Is crypto gambling legal?
It depends entirely on jurisdiction. Curaçao, which licenses most of the operators tracked in this report, completed its LOK transition in January 2025 and introduced crypto-specific compliance rules in June 2026 covering wallet segregation, transaction monitoring and blockchain-based AML. A September 2026 leak of the regulator’s files showed some licenses were granted while ownership checks were still open. Brazil banned crypto payments for gambling from 1 January 2025, and in September 2026 ordered its licensed online betting and casino market shut. The UK applies a 40% Remote Gaming Duty as of April 2026, and that duty follows the player rather than the license. In the United States, ten states have passed explicit statutory bans on sweepstakes casinos and four more block them under existing law, with Louisiana treating dual-currency sweepstakes as racketeering from August 2026 and Florida suing Stake under its existing gambling laws. Most crypto casinos operate under offshore licenses and accept players from jurisdictions where their legal status is ambiguous. Players are responsible for understanding the law where they live.
Which cryptocurrency is most used for gambling?
Tether dominates on both measures. It accounted for $2.63 billion of September deposit volume and 2.18 million individual deposits, and over the trailing 12 months it processed 22.0 million deposits against Solana’s 17.9 million. USD Coin ranks second by volume at $998 million and has grown 87% since October. Solana leads among non-stablecoins at $591 million. Combined, Tether and USDC represent 73.1% of all tracked deposit volume. Bitcoin’s native blockchain is not tracked by Tanzanite, so BTC deposits sent on Bitcoin L1 are excluded entirely, which means the stablecoin share is overstated by an unknown amount.
How big is the crypto casino market?
Published estimates disagree by a factor of eight. The most cited figure is $81.4 billion in gross gaming revenue from Yield Sec, reported by the Financial Times in 2025, but that number covers crypto sports betting, prediction markets and financial products alongside casino. Yield Sec confirmed to Gambling Insider in July 2026 that the casino-only component is roughly $48 billion. Tanzanite’s own onchain analysis put 2024 crypto casino revenue at $10 to $11 billion. This report tracks $48.8 billion in verifiable deposits across 41 operators over the trailing 12 months. Applying the industry convention of 37 cents of revenue per dollar deposited implies roughly $18.1 billion in trailing gross gaming revenue, which sits between the two competing estimates.
Are crypto casinos safe?
Safety varies considerably between operators, and onchain data gives one measurable signal: hot wallet reserves. The 41 tracked casinos held $389.5 million in visible balances on 1 October 2026, with Rainbet at $93.9 million, Stake at $62.3 million and BC Game at $35.6 million. The bottom 20 hold $13.1 million between them. Duelbits was hacked for about $7 million in September 2026, a reminder that hot wallets are exposed by design. Reserve levels do not prove solvency, since casinos also hold cold storage and fiat reserves that are not visible onchain. Beyond reserves, choosing operators with valid licenses under Curaçao’s LOK regime provides the strongest layer of player protection, though a September 2026 leak showed some of those licenses were issued before ownership checks were complete.
What is the average deposit at a crypto casino?
The market-wide average was $665 in September 2026, up from $559 in a revised August. Across the 24 operators above $10 million in monthly volume, averages range from $247 at Solcasino to $14,406 at Casinobet, a spread of 58 times between businesses described by the same two words. Stake sits at $731 across 3.09 million deposits and Rainbet at $298 across 1.07 million. Two thirds of all individual deposits are under $100, but those deposits carry only 2.6% of the money. Deposits above $100,000 are 0.08% of transactions and carry 43.1% of volume.
Do crypto casinos require KYC?
Under Curaçao’s LOK regime, all licensed operators must implement KYC and AML procedures, and the CGA rejects applications from anonymous crypto platforms outright. In June 2026 the regulator added crypto-specific rules requiring wallet segregation, transaction monitoring and blockchain-based AML, with implementation due by mid-2027. Enforcement is still catching up in practice. Some operators allow deposits before verification is complete, and platforms licensed outside Curaçao under jurisdictions such as Anjouan operate to different requirements. Brazil required biometric KYC at every licensed operator until a September 2026 provisional measure ordered its licensed online market shut.
What are the most popular crypto casino games?
SOFTSWISS data from more than 300 casino clients shows slots remain dominant, generating 85.6% of online casino gross gaming revenue in 2023. Live dealer games and crash titles such as Spribe’s Aviator follow. Crash games are particularly popular at crypto-native casinos, where operators run provably fair originals including Crash, Plinko, Dice, Mines and Limbo, some with house edges as low as 1%. Among the fully onchain casinos tracked here, Solpump and Solpot run provably fair mechanics on Solana with implied house edges of 5.24% and 4.99% respectively across the trailing year.
How many crypto casinos are there?
Tanzanite.xyz tracks 41 centralized crypto casinos and three fully onchain casinos, two of which are still operating. They include the largest by deposit volume, such as Stake, but are not an exhaustive count. Hundreds of smaller crypto-native casinos exist outside this coverage, though a Gambling Insider investigation found five typical tail operators took just $151 million combined across 2025, less than one percent of Stake alone. Fiat-first online casinos that also accept crypto are excluded entirely. No single source documents the total number of crypto casinos operating worldwide.
Is the crypto casino market growing?
Trailing 12 month deposit volume across the 41 tracked casinos reached $48.8 billion. September brought in $4.97 billion, up 15.2% on a revised August by value but down 3.3% by transaction count, with the average deposit rising from $559 to $665. The pattern across the market is fewer deposits at larger sizes. Growth is uneven at operator level: BC Game rose 92.7%, largely on two wallets depositing ARB on Arbitrum, and Duel 52.4%, while Rollbit’s tracked deposits fell to almost nothing. Whale concentration rose, with wallets above $100,000 holding 69.8% of volume in September against 64.7% in August.
Methodology & Data Sources
This report combines primary onchain data from Tanzanite.xyz with secondary market estimates from industry analysts, research firms and regulators. Each section below states what a source measures, how we use it, and where it can be checked.
Primary Data: Tanzanite.xyz
Every operator ranking, deposit volume, deposit count, average deposit, distribution table, wallet figure, hot wallet balance and onchain casino metric in this report comes from Tanzanite.xyz. Tanzanite monitors cryptocurrency moving into and out of known wallet clusters belonging to 41 centralized crypto casinos and three fully decentralized ones.
- What it measures: Deposit volume, deposit count, wallet-level distribution, hot wallet balances by chain and by token, and for onchain casinos, bet volume, gross gaming revenue and active players.
- What it does not measure: Wager handle, gross gaming revenue at centralized casinos, player counts, withdrawals, cold storage reserves or any fiat transaction.
- Measurement window: Tanzanite's data points sit 30 days apart rather than aligning to calendar month ends. Each monthly figure covers the 30 days ending on the date shown, and we label it by the month it mostly falls in. Onchain casino charts work the other way, with each point covering the month that starts on the date shown.
- Chains tracked: Ethereum, Tron, Solana, BSC, Polygon, XRP, Arbitrum, Base, Avalanche and TON.
- Tokens tracked: Tether, USD Coin, Ethereum, Solana, XRP, Tron, BNB, Dai, Arbitrum, TON, MATIC, Shiba Inu, Avalanche, Chainlink, TRUMP and Pepe.
- Bitcoin limitation: Bitcoin's native blockchain is not tracked. BTC sent on Bitcoin L1 is excluded from this dataset entirely. Wrapped BTC on Ethereum is included but is a small fraction, so every stablecoin share figure here is overstated by an unknown amount.
- Verifiability: All Tanzanite data derives from onchain transactions and can be checked independently against public block explorers.
- Transparency note: Tanzanite.xyz is supported by Stake.com. We disclose the relationship and note that it does not affect whether the onchain data itself can be verified.
Derived Metrics
Several figures here are calculated by VIP-Grinders from Tanzanite’s raw data rather than reported by the platform.
- Average deposit size: Total deposit volume divided by total deposit count for each casino, token or chain.
- Market share: Each operator's deposit volume as a share of the 41-operator total for the same month.
- Month on month change: The most recent 30 day window against the one before it. The three month rolling column is the mean of the last three windows.
- The Crypto Casino Whale Index: The share of a casino's deposit volume held in wallets above $100,000. Published for operators above $10 million in monthly volume, because below that a single wallet distorts the result. We compare it month with month, for the reason given under limitations below.
- Reserve coverage ratio: Total visible hot wallet balances divided by that month's deposit volume. A liquidity indicator, not a solvency measure.
- Reserve composition gap: The share of deposit volume arriving in stablecoins minus the share of hot wallet reserves held in stablecoins.
- Implied gross gaming revenue: Deposit volume multiplied by 0.37, the ratio published by Tanzanite from Stake's observable figures. We did not calculate that ratio and treat the result as an order of magnitude.
- Implied house edge: Gross gaming revenue divided by bet volume, possible only for the fully onchain casinos where both are visible.
Editorial Independence
VIP-Grinders operates affiliate relationships with some of the operators listed in this report, disclosed on their individual review and promo code pages. No operator pays for inclusion in this dataset, for its position in any ranking, or for how it is described. Rankings are determined solely by onchain deposit volume as tracked by Tanzanite.xyz.
We have no commercial relationship with Tanzanite.xyz. Tanzanite is supported by Stake.com, which is the largest operator in this dataset, and we state that wherever their data carries an argument rather than just a number.
Where our findings contradict something we previously published, we say so in the text rather than quietly restating. This edition corrects two claims from the August edition, each marked where it appears: BC Game’s August decline, which Tanzanite’s later revision reversed, and the claim that whale concentration was falling. Re-reading August on the same basis as September, including that revision, moves the August market total from $4.23 billion to $4.31 billion.
Secondary Sources
Market sizing, industry context and regulatory information come from the sources below. These are not our data. We cite them with their source and flag where methodologies differ.
| Source | What It Measures | How We Use It |
|---|---|---|
| Yield Sec / Financial Times | All crypto gambling GGR across every vertical | Upper bound, with the casino-only component separated out |
| Gambling Insider | Onchain deposits across 12 casinos, and the Yield Sec interview | Independent onchain comparison and source of the vertical breakdown |
| SOFTSWISS | Crypto share of bet volume across 700+ partner brands | Operator-level adoption rates and currency mix |
| Grand View Research | Total online gambling market size | Context on online gambling market size |
| Mordor Intelligence | Total online and offline gambling market size | Context and cross-referencing |
| Surgence Labs | Global online gambling GGR and crypto’s estimated share of it | Denominator for crypto’s share, and an independent check on our implied revenue figure |
| Business Research Insights | Crypto casino B2B software market | Flagged as vendor revenue, not player facing |
| Blockonomi | Crypto gambling market size, no source or method given | Flagged as unsourced and implausibly low |
| Curaçao Gaming Authority | LOK licensing regime and enforcement actions | Regulatory context for operator licensing |
| Follow the Money | Leaked Curaçao Gaming Authority licensing files | Reporting on ownership checks at licensed operators |
| Florida Attorney General | Lawsuits and letters on sweepstakes casinos | Regulatory context for US enforcement |
Limitations
Known limitations readers should weigh when interpreting anything on this page.
- Coverage is not exhaustive: Tanzanite tracks 41 centralized crypto casinos and three onchain casinos. Hundreds of smaller crypto casinos sit outside this dataset, and fiat-first casinos that accept crypto are excluded entirely.
- Deposit volume is not revenue: This report measures crypto flowing into casino wallets. It does not measure what casinos keep, what players lose, or total wager handle.
- Bitcoin L1 is not tracked: A known gap that affects every currency share calculation on this page.
- Hot wallet balances are partial: Only addresses Tanzanite has identified. Cold storage, custodial accounts and fiat reserves are invisible. A low balance does not indicate insolvency.
- Two balance sources exist: A live snapshot and a monthly timeseries. They disagreed more in September than before, with Stake at $62.3 million on the snapshot against $126 million on the timeseries. We use the snapshot for current balances and the timeseries for trend, and never mix a figure from one with a figure from the other.
- The distribution panel counts fewer deposits: Bucket-level deposit counts total 6.87 million for September against 7.46 million in the headline count. The token and chain panels place most of the gap on Tron, XRP and TON, where the headline count includes near-zero transfers, while volume reconciles almost exactly. We report count-level bucket figures on the panel's own denominator.
- Wallet tiers depend on the period measured: A wallet is sorted by everything it sent across the period shown, so a year always looks more concentrated than a single month. That is why the Whale Index is compared month with month, and why the August edition's comparison with the trailing year has been withdrawn.
- Wallets are not players: One person can control several wallets, and custodial arrangements can pool many. Wallet counts are the closest verifiable proxy for depositor numbers, not a headcount.
- Tooltip rounding: Some figures are read from dashboard displays that show rounded values. Exact figures may differ slightly from a raw data export.
- Coverage changes retroactively: The dashboard renders the current operator roster across the whole period. If Tanzanite adds operators, historical totals rise, including months already published. Trailing figures should be read as current-panel figures.
- History can be revised: In September Tanzanite revised BC Game's history, raising its August deposits from $46.1 million to $164 million. We re-read the previous month for every operator each edition and report any change. August distribution and wallet figures, and every month before August, come from our earlier reads, which predate that revision, so treat comparisons with them as approximate.
Update Schedule
This report is part of the VIP-Grinders research program and is updated monthly. Each edition refreshes every Tanzanite dataset, recalculates the derived metrics, and notes any change in secondary estimates or regulation.
Section headings on this page are fixed and will not change between editions, so any link to a specific section will keep working. Figures, findings and commentary change every month.
For how crypto poker fits into the wider online poker landscape, see our Online Poker Traffic Report, which ranks 36 networks by cash game players and tournament entries every month.
If you are a journalist, researcher or analyst using data from this report, contact João Mourato at VIP-Grinders for verification, additional context or access to the underlying tables.