How to use Hold’em Manager to Maximize your Profits
Last week, we wrote about the advantages of tracking software and HUDs, and I recommended Hold’em Manager as the software of choice.
This week, we go further in depth regarding how to use Hold’em Manager to improve your play and maximize your profits.
The Reports Tab
The “Reports” Tab is your home for reviewing your own play. From here, you can generate a results graph and a variety of reports for your play.
In your reports tab, you will want several key pieces of information about your results: Winnings, Winrate, Rake, and Rake in bb/100.
For gameplay stats, you’ll want VPIP, PFR, 3Bet, Fold to 3bet, Aggression Factor, Open Raise %, Cbet % and Fold to Cbet % at the minimum.
WWSF (won when saw flop) and WTSD (went to showdown) percentages can be useful as well. Do some research on your own to find the normal ranges for these values so you can understand what’s high, what’s low and what’s optimal.
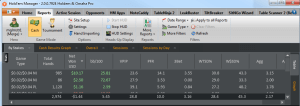
In the image below, you’ll see the tab is sorted by stake. This allows you to track your results and gameplay at each individual limit.
Also note the filters (Date Range, Game Type) at the upper right position of the window. Explore these.
There are a massive number of filters you can use to study your play under even the most specific conditions.
For example, you can study how you play suited connectors OOP after flatting a preflop raise and check-raising the flop against two opponents.
Hold’em Manager’s Reports Tab sorted by stake.
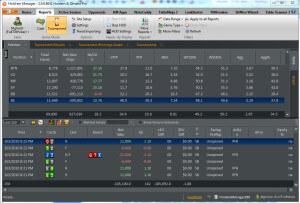
Another very useful strategy is to sort by position, so you can study your winnings at each position to identify areas of strength and weakness.
You’ll also notice the “HUD Settings” box. We could write an entire series on optimal HUD configuration.
For now, you want it to display Player Name, Hands Played, VPIP, PFR, 3bet, Fold to 3bet, Aggression Factor, Cbet and Fold to Cbet. That’s it.
Get comfortable with just those stats for now, and keep in mind that you should never make judgments based on stats like Cbet and 3bet until you have several hundred hands against a player.
Hold’em Manager’s Report Tab sorted by position
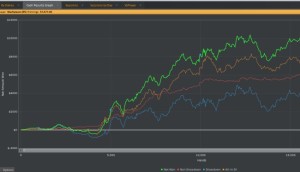
Hold’em Manager also generates excellent graphs that allow you to share your results with others or visualize your progress. These graphs can be customized to show specific information based on your filters.
Hold’em Manager’s Results Graph
The Opponents Tab
The real fun is learning how to use Hold’em Manager to exploit your opponents. The “Opponent’s” tab lets you study your opponents to find leaks.
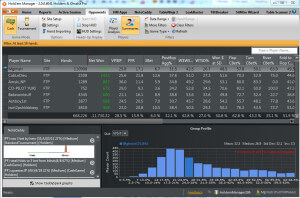
The Summaries Portion of the Opponents Tab
This is what the Opponents Tab looks like when set to “Summaries”. You receive a detailed summary of the people you’ve played against. Use this to quickly scan for players with irregular stats.
The graph in the bottom left allows you to see how that player compares to all of the players in your database. From here, you can get an idea if people are playing too aggressive, or too tight.
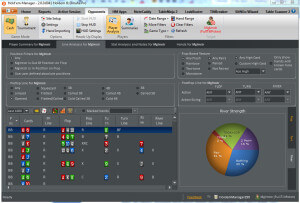
The “Player Analysis” section puts a focused lens on any opponent. You can sort with a variety of filters to find a massive variety of information on any opponent. You can find your opponents’ hands in specific situations to study their gameplan in detail.
The Player Analysis section of the Opponent’s Tab
Conclusion
Hold’em Manager is a tremendously useful tool that every grinder should be using in their play.
In this article, we have outlined broad ideas behind how you should be using Hold’em Manager to keep track of your own play, configure your HUD and find your opponents’ leaks.


